How to Read Sim Racing Telemetry
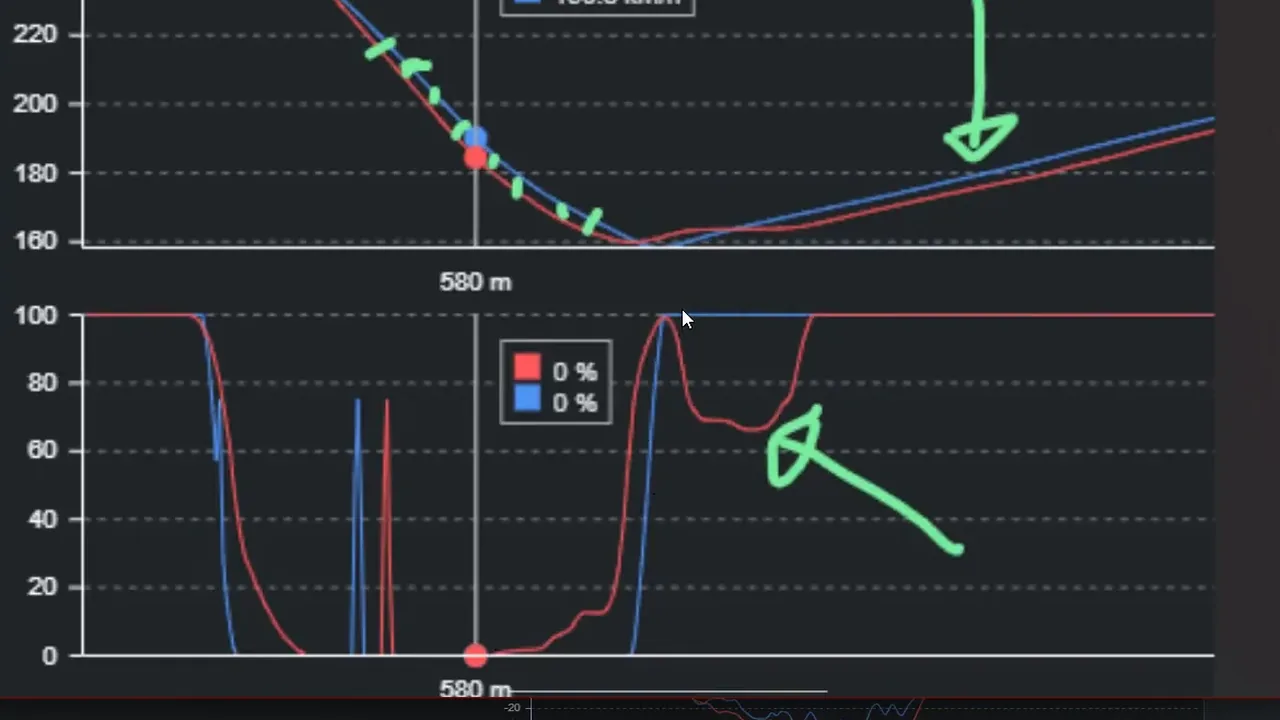
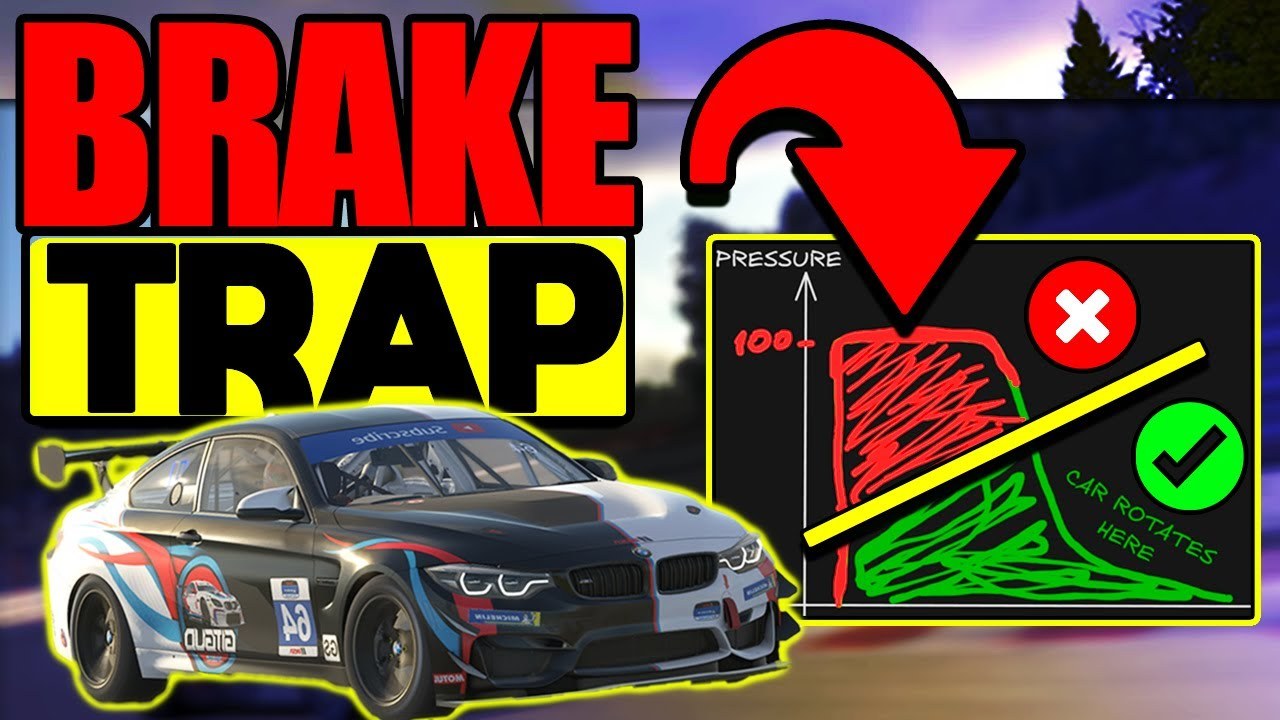
Most drivers open telemetry the same way: they pull up their lap next to a faster one, stare at the brake trace, notice that the other driver brakes later, and go back out to brake later. It rarely works, because the brake trace was not where the time went — it was one of five things that were different in that corner, and usually not the first one. (When the trace really is the first difference, moving the braking point is its own procedure, and it starts from the deceleration end rather than the marker: how to brake later.)
How do you read sim racing telemetry?
- Find the loss in the delta. The time-delta graph shows which corner cost the most. Start there, not at turn one.
- Check the line and the speed there. Did both cars drive the same corner? Where do the entry, minimum and exit speeds differ?
- Inspect the inputs around the first meaningful difference. Brake, steering, throttle — and stop at the earliest difference that matters, because the later ones are usually its consequences.
- Test one change. A trace points to a likely cause; only the next laps show whether it was the right one.
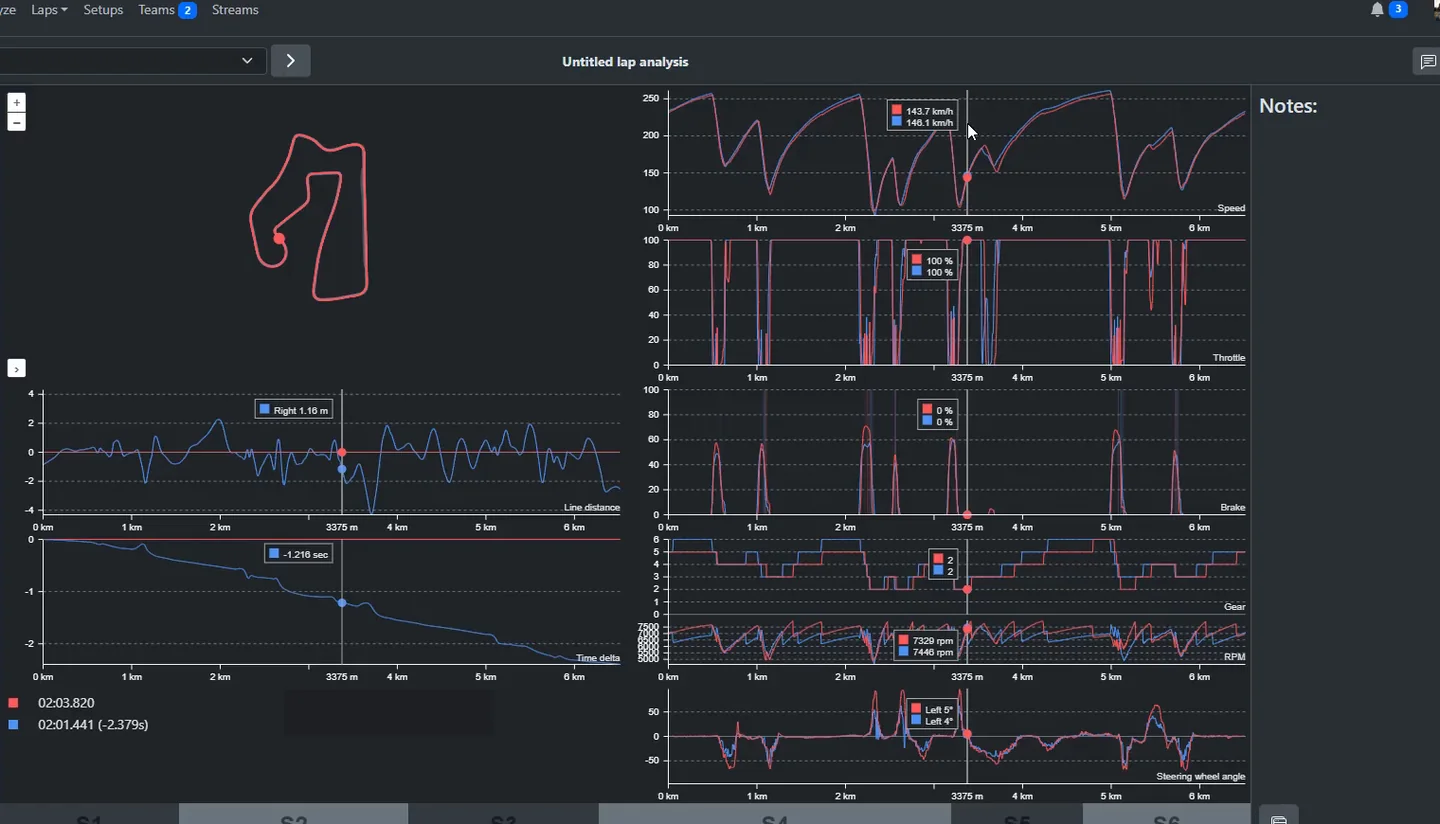
This is how we read a lap in a coaching session, and the method is the same in Garage61, MoTeC or anything else. Every screenshot on this page comes from two real comparisons: a member's lap against a driver 2.3 seconds faster, from a live Academy telemetry workshop, and a coach's lap against a member 1.8 seconds slower, from our Ferrari 296 GT3 course.
On this page: Read the traces · Worked example · Choose software · Practice routine
What is sim racing telemetry?
Telemetry is the record of what the car and your inputs were doing at every metre of the lap: speed, throttle, brake pressure, gear, engine speed, steering angle, and in most tools the position of the car on track. Every major sim exports it — iRacing writes it natively, Assetto Corsa Competizione exports MoTeC files, Le Mans Ultimate and Automobilista 2 expose it to third-party tools — and a comparison tool lines two laps up by distance so you can see, corner by corner, where one driver did something different. The tools differ in polish; the traces do not. Once you can read one set, you can read them all.
The right order to analyse sim racing telemetry
The order matters more than any individual trace. Read them in the wrong sequence and you will confidently fix a consequence.
1. Start with the lap delta
Do not open the channels yet. Open the time delta — the graph that shows how the gap between the two laps evolved around the circuit. It starts at zero and, wherever it slopes downward, you are bleeding time. Where it is flat, you are keeping up.
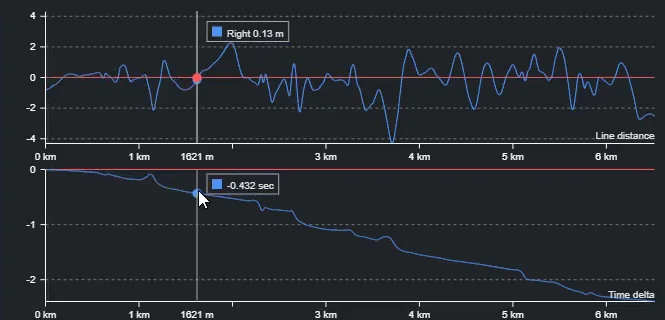
This tells you where to look, not yet why. If you are +0.02 at turn one, +0.04 at turn two and +0.31 at turn three, you do not have a slow lap. You have a turn-three problem, and the next forty minutes should be spent on turn three.
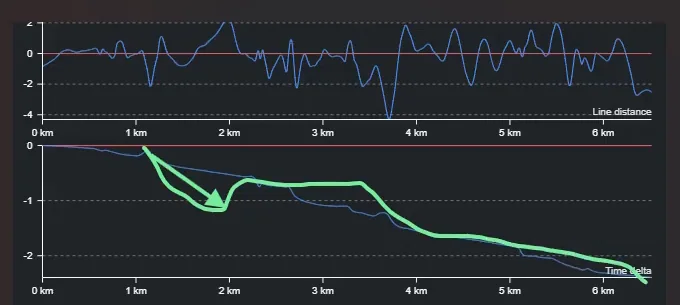
Two refinements. First, zoom to a corner and a half — from the start of braking to the start of the next braking zone — so the exit is included; a corner that looks fine at the apex can still be where the straight was lost. Second, a small bump upward followed by a bigger drop is a signature worth learning: it usually means the driver carried more speed in and paid for it on the way out.
2. Compare the racing line
Before you look at a single pedal trace, ask whether the two cars actually drove the same corner. Most tools now show line distance — how far your line deviated from the reference's, metre by metre — and it changes what the rest of the traces mean.
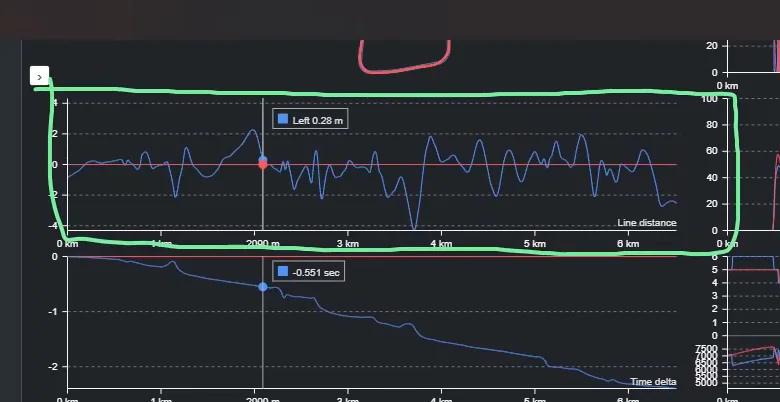
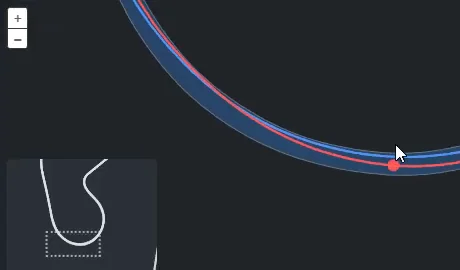
A driver braking five metres later than you may simply be on a different line. If the lines differ, the question is not "why is his braking later" but "which line is worth it" — and the delta answers that. Only when the lines match does a pedal comparison mean anything.
3. Check the speed trace
Now the top graph. Where one trace sits above the other, that driver is faster at that point. Read four things: the speed on entry, how fast it falls, the minimum, and the speed on exit.
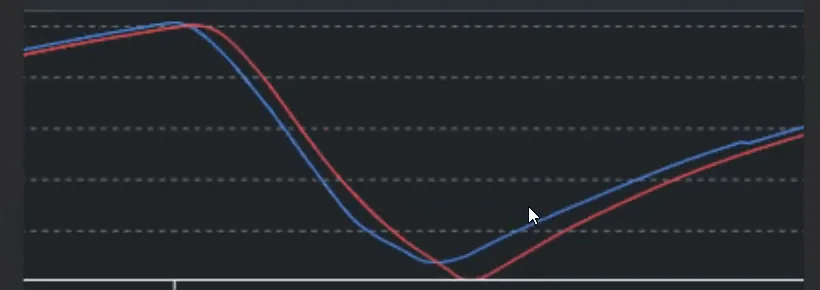
The key teaching point of the whole page is here. Speed tells you what happened; it does not tell you why. Being 7 km/h slower at the apex does not mean "carry 7 km/h more". It might be an earlier brake, a poor release, a different line, an early apex, oversteer, or too much steering. The speed trace tells you which corner and which phase to investigate. The next three traces tell you the cause. If reading them yourself is the part that stalls, see how a coach analyses a lap instead.
4. Read the brake trace
Now the brake. Look at the braking point, the peak, how quickly it got there, how the pressure comes off, and how much is still on when the steering starts. Do it across the whole lap first, because patterns matter more than individual corners.
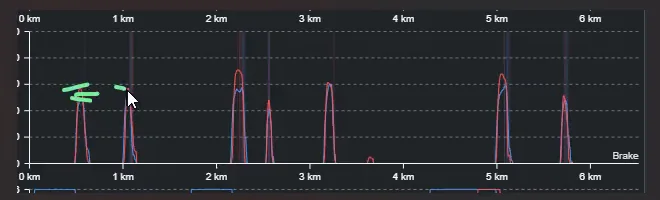
You will separate two things constantly in this trace: braking later and braking better. They are not the same, and the most common misreading in sim racing is confusing them. There is an example below.
5. Compare steering
The steering trace is the closest thing telemetry has to a balance readout. Ask: is one driver using more steering than the other? Did steering increase without producing more rotation? Are there corrections? Is the angle held too long?
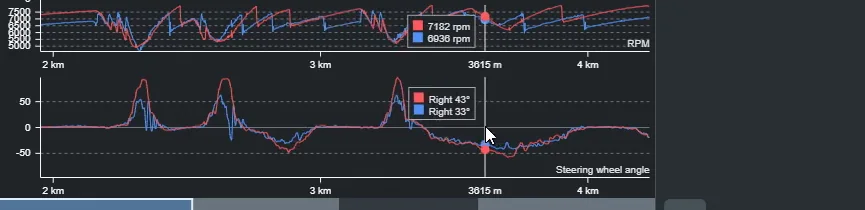
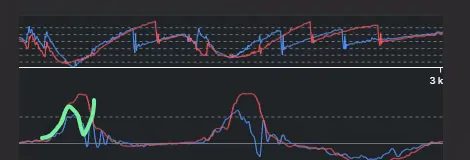
This is where the physics in how to find the grip limit becomes readable on a graph: past the front tyres' peak, more angle produces more slip, not more turning, and the trace shows you a driver adding lock into a car that has stopped responding. Why the car got there is usually a weight transfer question, answered by the brake trace.
6. Compare throttle
Last, the throttle: where it starts, how much comes on initially, whether it rises cleanly or in steps, whether there are lifts, and — most important — where it reaches 100%.
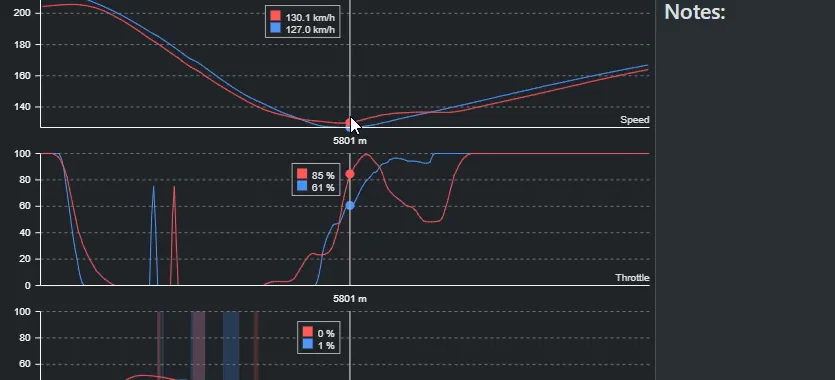
Earlier throttle is not always better. If the reference reaches full throttle later but with a straighter car and a higher exit speed, copying only the throttle point will make you slower. We see this so often it has its own section.
7. Find the first meaningful difference
You now have five differences. The job is to find the earliest one that matters, because in most corners the later ones are consequences of it. Here is the real chain from the workshop, in the corner where the member lost a tenth against a 7K driver with braking that looked, at first glance, nearly identical.
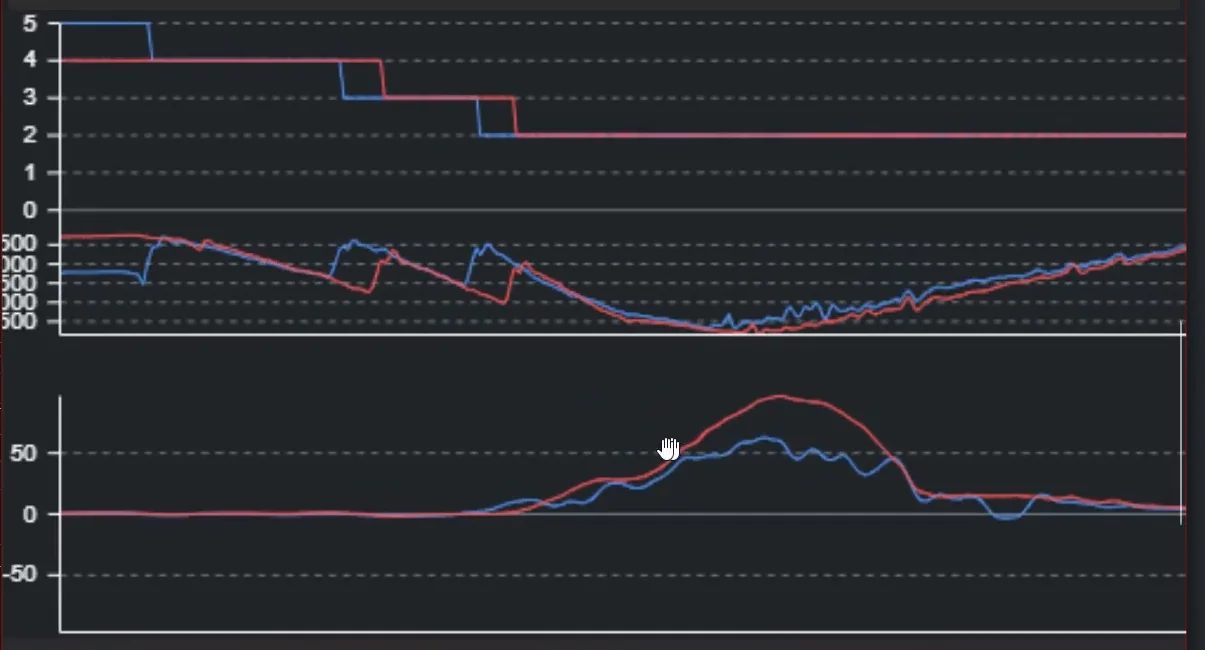
Read it in three layers. What the traces show: a later downshift at the same engine speed, more brake pressure, ABS during the trail, and more steering. The explanation that links them: less engine braking meant more pedal pressure to slow the car, which triggered the ABS while turning, which cost front grip at turn-in, which produced the extra steering. What to test: downshift sooner, and see whether the pressure, the ABS and the steering come down with it. A driver reading the traces as a checklist would fix the steering; a driver reading only the speed trace would say "carry more speed". If the chain is right, one change removes four symptoms. If the extra steering is still there on the next comparison, the chain was wrong, and you look again. A student spotted this one during the session, from the RPM trace, and it was the best observation of the night.
Telemetry mistakes: cause vs consequence
The same handful of differences shows up in nearly every corner. Most of them are consequences, and each has more than one possible explanation. Keep this table open while you analyse: it separates what the graph shows from what might explain it and what you can test.
| What the graph shows | Possible explanations | What to check, then test |
|---|---|---|
| Lower minimum speed | Braking earlier, or harder for longer; a different line or apex | Check the brake trace at the crossover point, not the braking point. Test softer or shorter braking before trying to carry more speed. |
| Later full throttle | An early apex, or a line that leaves the car pointed wrong; sometimes a deliberately later, straighter exit | Check line distance and where the minimum speed sits. Test the apex, not the throttle point. |
| More steering | Too much entry speed for the line, front grip lost to ABS in the trail, or simply a tighter line | Check the brake trace in the trail phase, and the line. Test a bigger initial release of the brake. |
| Heavy ABS activation | Late downshifts, or braking too hard because too late | Check the gear and RPM traces. Test the downshift timing. |
| Slow exit | A wrong apex, or a throttle applied too early and corrected | Check the throttle's 100% point and the line. Test the apex first. |
| Throttle correction mid-corner | Over-slowing on entry, then reaching for the pedal | Check the speed trace on entry. Test a little more entry speed and one clean throttle application. |
Fix the earliest meaningful difference in the chain. If your minimum speed is low because you braked too hard, do not practise carrying more speed — practise braking. If your throttle is late because your apex is early, do not practise throttle — practise the line. It sounds obvious written down; almost nobody does it. And treat every row as a lead, not a verdict: one trace narrows the search, it does not prove the cause. The next laps do.
What telemetry can — and can't — tell you
Telemetry is extraordinarily good at answering one question: what was different? It will tell you, to the metre, that you braked nine metres earlier, held 12% more brake into the apex, added 18 degrees more steering and reached full throttle 0.35 seconds later. It will not tell you which of those caused the others.
And there are two things it cannot see at all. It cannot see what the reference driver was feeling — whether that lap was at the limit or comfortable, repeatable or a one-off. And it says nothing about the car's balance directly; you infer it from the steering trace. For the parts telemetry cannot see, you use the replay. For the part where you know what is different but not what to do about it, you use a coach.
Worked example: one full lap comparison
One complete comparison, read in the order above. It comes from our Ferrari 296 GT3 course: same car, same fixed setup, similar conditions, the coach 1.8 seconds quicker than the member. There is no universal shape for a good trace — a GT3 brake trace on ABS looks nothing like a Formula car's, and a fast corner looks nothing like a hairpin — so read what follows as patterns for this kind of car, not as targets.
Where the time went
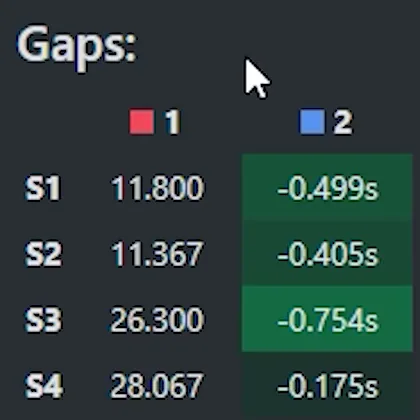

Turn one: later and softer, and quiet in the trail
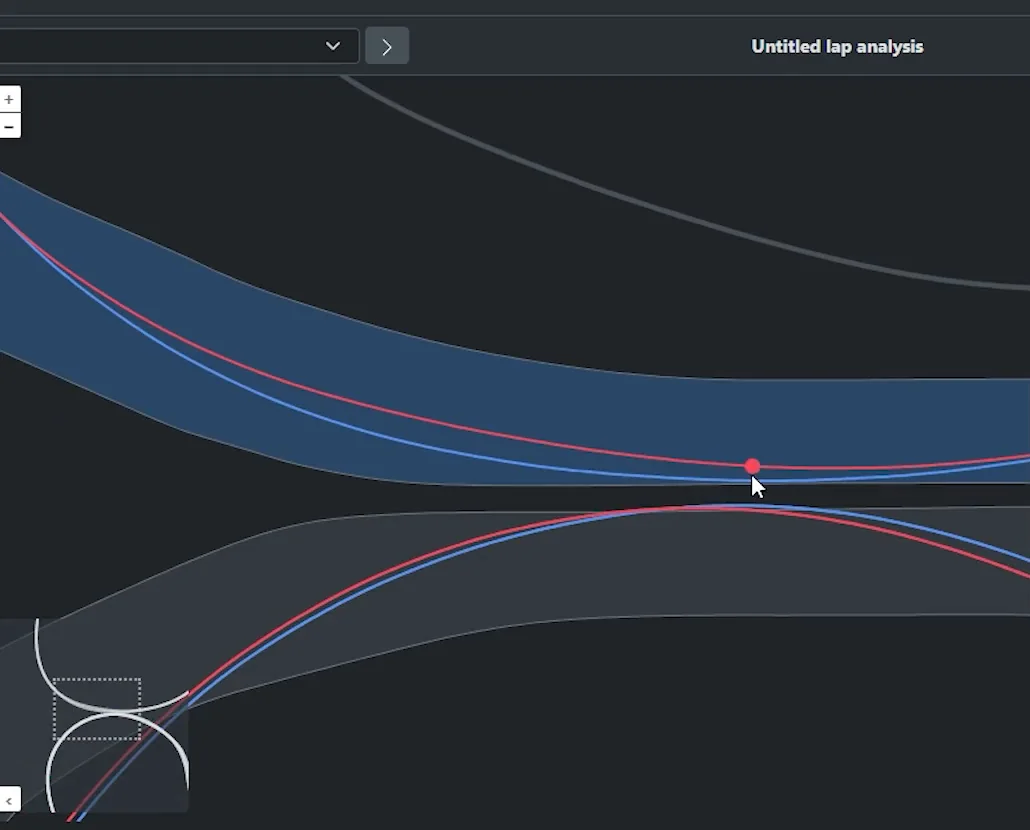
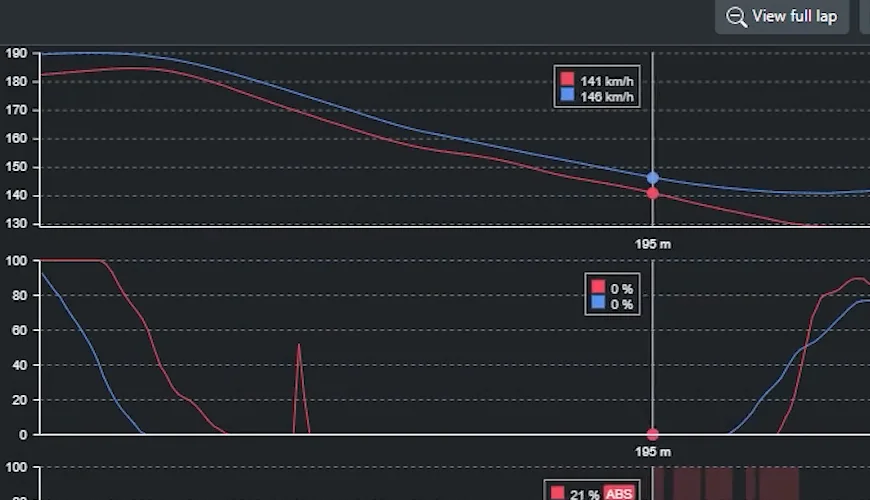
What the traces show: the coach brakes later and about 10% softer and finishes the corner right against the wall; the member's brake trace shows ABS in its low-pressure tail, with the wheel turned. Possible explanation: too much pressure held into the turn, so the front tyres had less grip left for turning, and the tighter exit followed from that. The map is checked first because a different line choice could also explain a tighter exit. What to test: a bigger initial release, so the trail sits below the ABS, and whether the exit then moves out toward the wall.
A good brake trace in a GT3 gets to its peak quickly, sits just under the point where the ABS intervenes, and comes off progressively into a trail that stays below the ABS threshold with the wheel turned. The threshold is not a number: in some corners the ABS triggers at 90%, in others at 40%, depending on the corner's shape and camber. "Dance at the limit of ABS" is the target, and it is only findable by looking at where the vertical lines appear in your own trace.
Turn two: brake, release, blip, brake
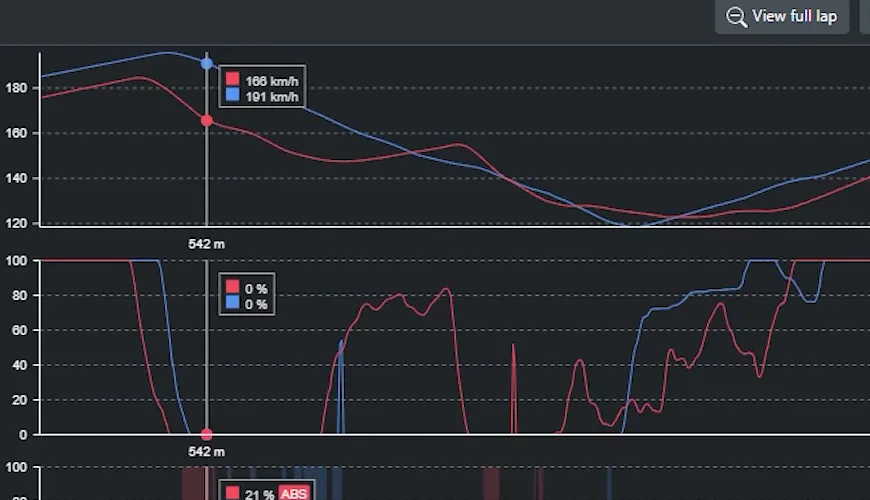
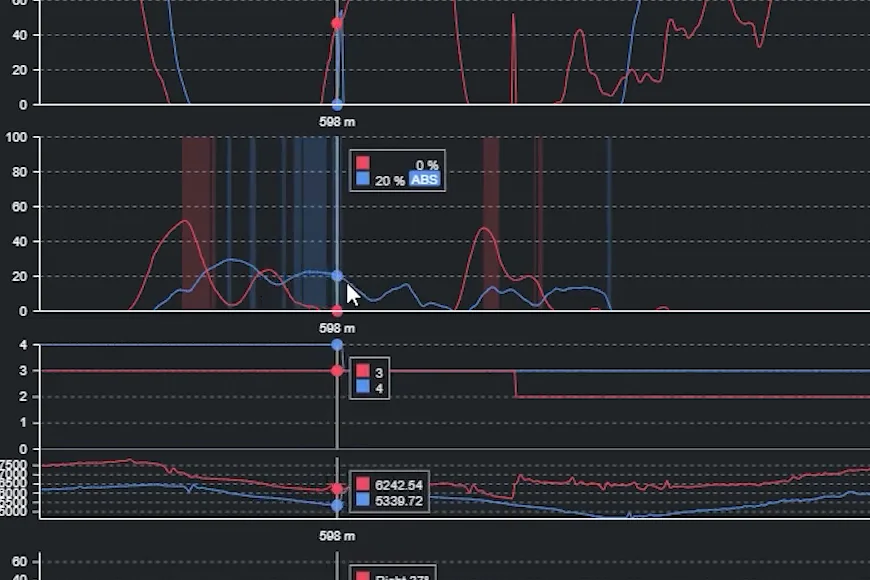
Every one of those extra inputs is a weight transfer: brake loads the front, throttle unloads it, brake loads it again. The car never settles. The alternative is to carry more speed in and keep the brake engaged at a low, reducing pressure — "the moment you drop the brakes is the moment you lose all the rotation." In this lap, that corner was worth four tenths. If you see two brake applications in one corner of your own trace, test one continuous, reducing application there and let the delta through that corner tell you whether it worked.
The number that separates the two laps: 1% against 30%
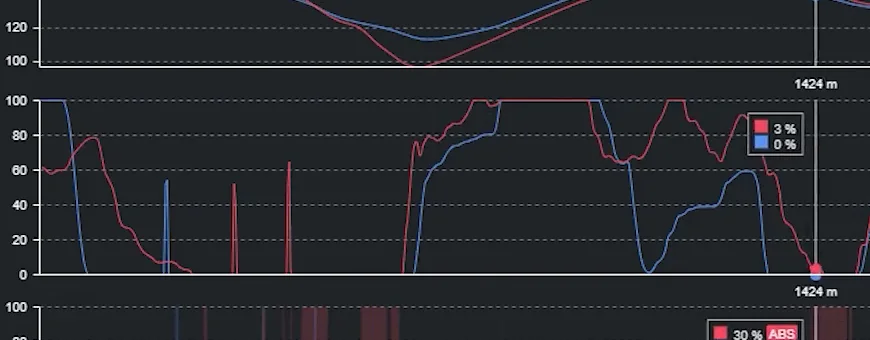
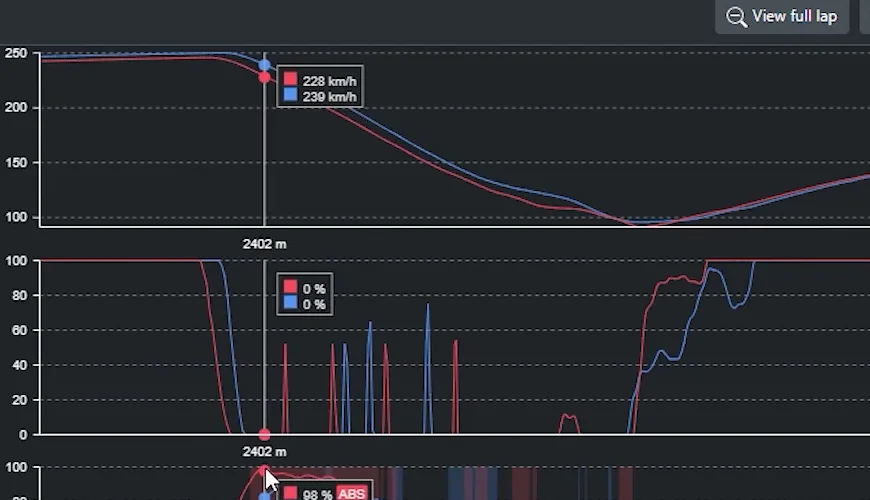
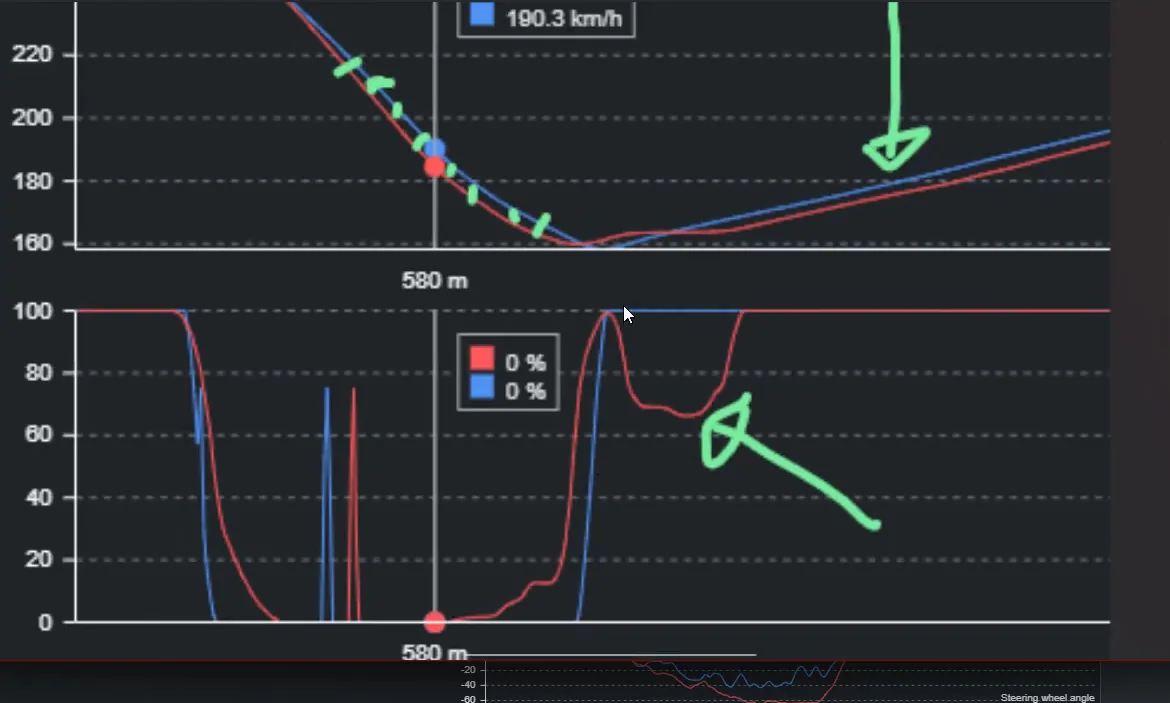
"This is where you will see yourself compared with quicker drivers most of the time. They are able to stay a bit lower on the brakes." Finding the minimum brake pressure that still does the job is the single most transferable thing telemetry can teach a GT3 driver, and it is invisible from the cockpit until you see the two traces side by side.
The one thing to take into the car
Across the lap, the same thing keeps appearing: more brake pressure than the job needed, and ABS while the wheel was turned. Because it repeats, it is a pattern rather than a one-corner fault — but the traces still only make the diagnosis likely. The test is one change in one corner: a single, softer, reducing brake application, then a new comparison. If the ABS lines move out of the trail and the delta through that corner flattens, the diagnosis was right. If not, go back to the line.
How to read a brake telemetry trace
Four phases: the point where the pedal goes down, the peak, the release, and the trail — how much pressure is still on while the car is turning. The GT3 and Formula guides cover what the right shape is for each car; here the question is how to read the difference between two traces.
Braking later is not braking better
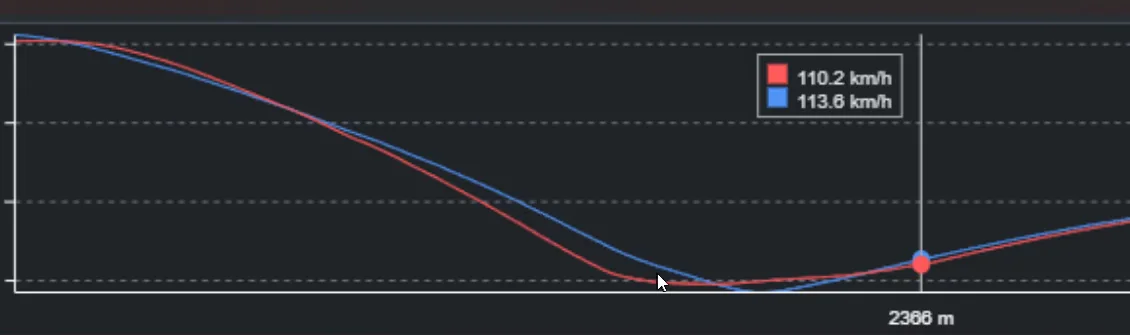
This is the corner with the biggest peak-pressure gap of the whole lap, and it inverts what most drivers believe. The reference braked earlier and softer; the member braked later and harder; the member arrived at the corner slower. Braking later gained time for a few metres and then handed it back with interest, and the harder stop also lit up the ABS, which meant the tyres were hotter and the front had less to give when the steering started.
"Braking later doesn't mean you're pushing more speed. What matters is how hard you brake and how long you hold it." If you take one line from this page into the car, take that one.
ABS in the trail phase
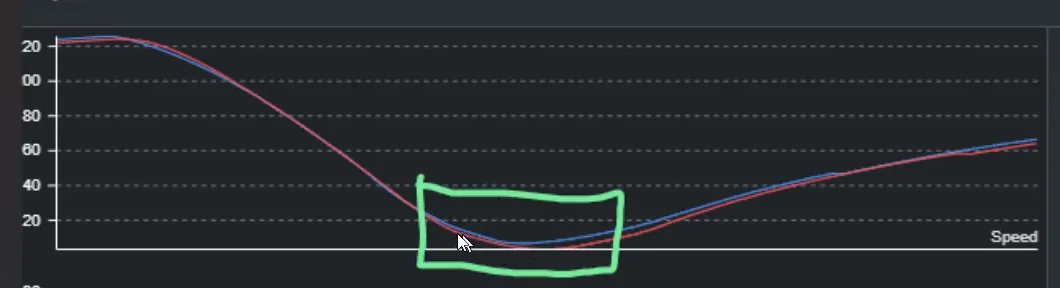
Everyone knows to watch for ABS at peak pressure. Far fewer know to watch for it at 20% while the wheel is turned, and it is the more expensive of the two, because a tyre that is locking and unlocking cannot also turn the car. The fix is not "less trail braking" in general; it is a bigger initial drop in pressure so the trail settles below the ABS threshold. The trail braking guide covers the release itself; this is how you spot the fault in data.
When to distrust the faster lap
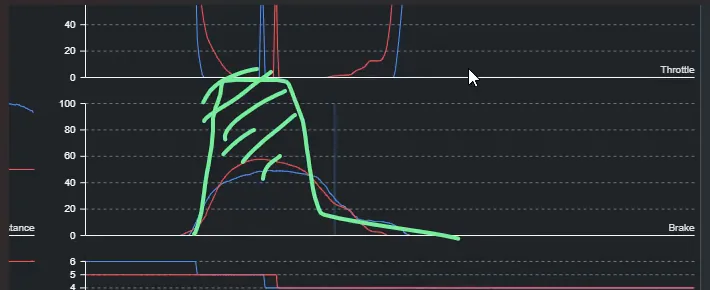
A faster lap is not automatically a lap to learn from. A GT3 driver slamming 100% pressure into the ABS and still being quick is being quick despite that, not because of it, and copying it will teach you a fault. This is why telemetry is not a beginner's tool: you need enough understanding of braking to know when the data in front of you is wrong. If you are not sure, that is the moment to ask someone who is.
How to read throttle telemetry
The throttle trace lies to beginners more than any other, because the obvious reading — earlier is better — is so often backwards.
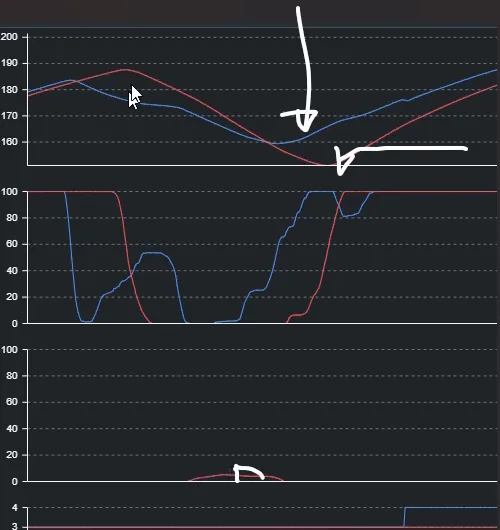
The cost of that corner was about a tenth, and the two apex points were roughly 30 metres apart. The member had slowed the car too much on entry, arrived at an early apex, felt the car was slow, and reached for the throttle — which the car could not take, so he had to add steering and then lift. The reference pushed a little more speed in, took a later apex, and applied the throttle once.
Judge yourself on the moment you reach 100%, not the moment you first touch the pedal, and treat any dip after the throttle starts rising as a fault to trace backwards. "If you see yourself doing these throttle corrections, check the apexes, check the speed trace, check the braking. You might be braking too much."
Coasting
Brake at zero and throttle at zero is coasting, and the trace shows it as a gap between the end of one and the start of the other. Sometimes it is legitimate: a very fast corner where the car needs neither, or the wet, where a little coasting on entry keeps the rear settled. Usually it is wasted time — the car is neither slowing nor rotating nor accelerating. Read it corner by corner: the reference driver's gap in the same place tells you whether it belongs there.
How to read steering telemetry
Steering angle is the trace people ignore, and it is the one that most reliably says what the car was doing. A student who joined the workshop late asked which graph tells you whether you are understeering or oversteering. This one. What a correct steering trace should look like phase by phase — near zero at peak brake, peaking just before the throttle, never rising after the apex — is laid out in sim racing steering technique.
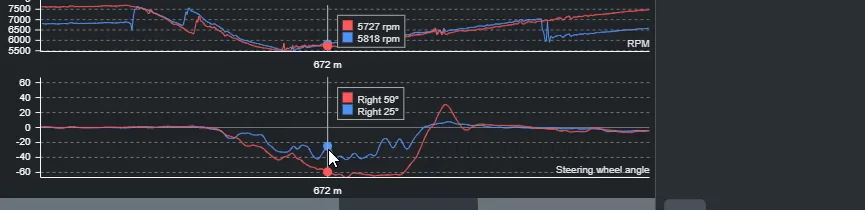
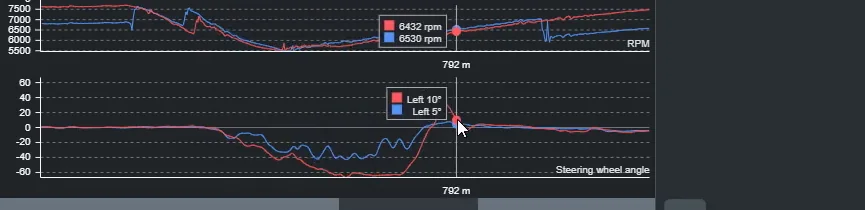
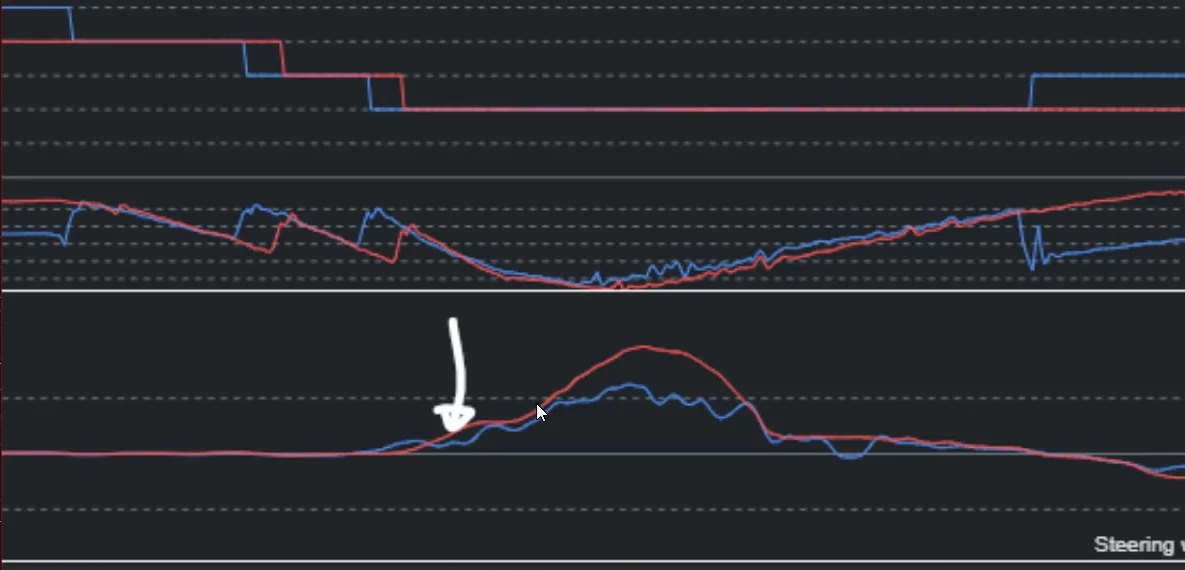
Three things to read here. Whether one driver is using more steering everywhere, which is a balance or driving-style pattern. Whether the steering keeps increasing after the car has stopped responding, which is a driver stacking lock onto understeer. And whether there are corrections, which tell you the lap was at or over the limit. The correction to understeer is never more steering; it is at the pedals — a softer throttle, or in a slow corner a touch of brake to put weight back on the front. Telemetry cannot make you feel that earlier, but it can show you exactly how late you are currently catching it.
More examples from the workshop
Three more corners from the workshop lap, read in the same order. The member was a strong driver — against a 7K reference, losing a tenth a corner is normal — which is exactly why the examples are useful: nothing here is a crash or a blunder. It is the small, repeated inefficiency that separates good from fast.
Example 1: the corner where he was faster
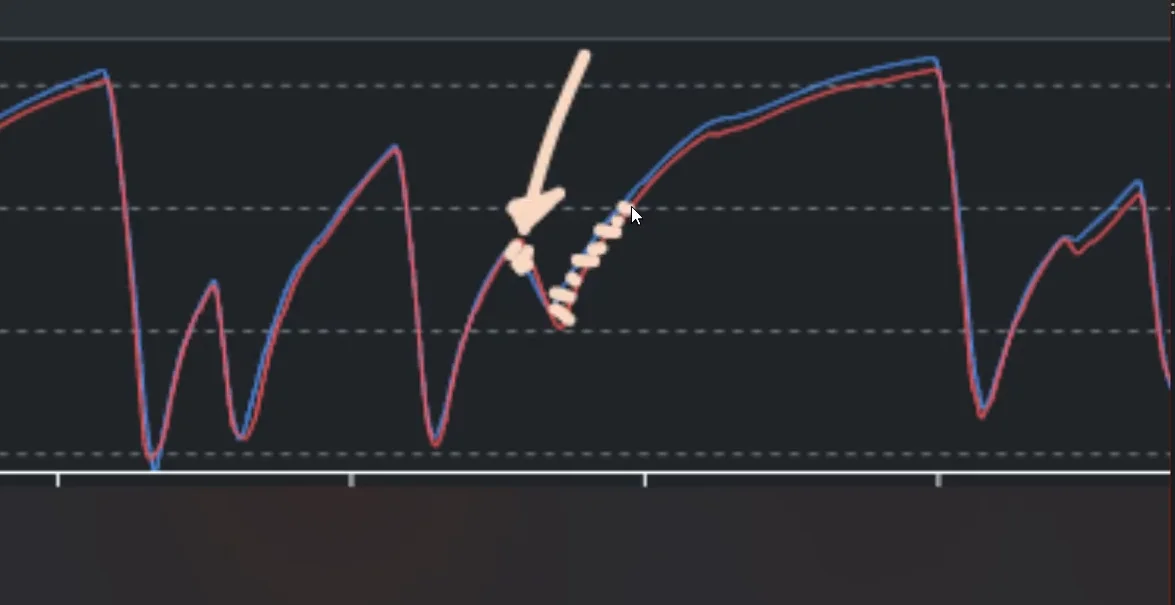
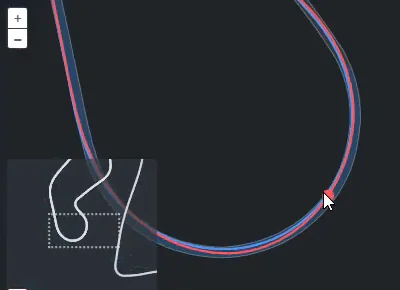
A longer line can be faster — but only if you are first to full throttle, because otherwise you are simply going the long way round. He was not; he was later on the throttle, still unable to rotate the car, and lost more on the exit than he gained on the entry. The telemetry could not say whether the wider line was wrong, but it could say that this version of it was not working. Next session: explore a tighter entry and see whether the exit comes back.
Example 2: track usage
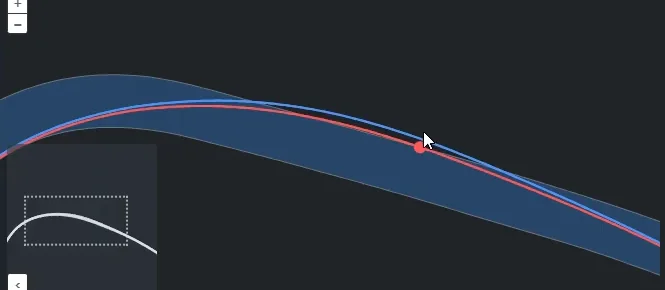
This one is not a driving fault; it is knowledge. The faster driver knew where the limit was in that corner and used it, and the only way to learn that is to look, corner by corner, at where the fast laps actually go. Once you know the rule for each corner, the same check applies at the apex.
Example 3: 1% more entry speed
The fast corner from step 6 above, where the member's minimum speed was higher than the reference's — but not from braking. He slowed the car more on entry, then pressed the throttle so early that his speed at the apex was higher, then had to lift. The reference's minimum was lower and his exit was much better.
The coach's prescription was almost embarrassingly small: "1% more speed on entry means 1% later on the throttle. It is a matter of 20 metres." Twenty metres of patience was the whole correction, and it would have removed the lift, the steering, and the lost exit at the same time. That is what the first-difference rule looks like in practice.
Which lap should you compare your telemetry against?
This is the skill nobody teaches, and it decides whether the rest of the analysis means anything.
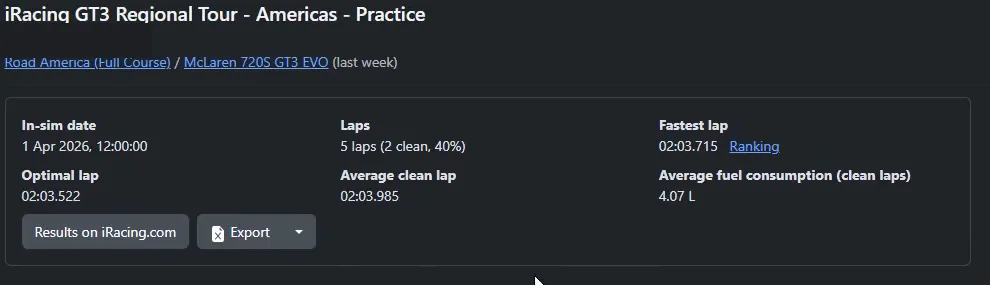
Do not blindly pick the fastest driver in the world. Pick someone in the same car, on the same track, in similar conditions, ideally the same setup, and realistically faster — about a second is often the most useful gap. A world-record lap four seconds up the road is built on a car balance and a confidence level you do not have yet, and copying its visible inputs without the rest usually just makes you inconsistent.
Three practical rules from the workshop:
- Filter to the current season. The sims change their cars constantly; a GT3 from two seasons ago does not produce the same laps.
- Use your own practice session. An official practice usually contains someone much faster, in a fixed setup, in exactly your conditions. If their data is public, it is the best reference you will find.
- Check the reference driver's other laps. If one lap is a 1:41.4 and the next ten are 1:42.0, learn from the 1:42.0. It is what he can actually repeat. A lap covered in oversteer corrections is a lap on the edge; "if you are three seconds slower, trying to replicate that will not help you at all."
And compare your own laps. Take your fastest three or four from a ten-lap run and lay them over each other. Where they differ — 60% brake one lap, 45% the next, 80% the one after — is where your consistency problem lives, and no reference driver can show you that. Why your lap times are inconsistent is the diagnosis that follows.
Best sim racing telemetry tools
The tool matters much less than the method, which is why this section comes after it. Pick the one that does your job, not the one someone calls the best. Support and pricing change; check them when you read this.
| Tool | Best for | Main sims | Difficulty |
|---|---|---|---|
| Garage61 | Easy lap comparison against a large pool of community laps; the analysis in this article | iRacing-focused | Easy |
| MoTeC i2 | Deep, engineer-grade analysis with full channel maths | ACC natively; others via export | Advanced |
| Popometer | Driver-to-driver comparison with guided views | Several supported sims | Medium |
| Track Titan | Guided, explained analysis for drivers who don't want raw traces | Several supported sims | Easy |
| SimHub | Live telemetry, dashboards and overlays while driving | Broad | Medium |
Two notes. Garage61 is free to start and, for iRacing, has a very large library of comparable laps — which is the thing that actually matters, since the reference lap decides everything. And an overlay that shows you a live delta while you drive is a different tool for a different job: it is good for confirming a change in the car, and bad for learning, because it makes you chase the number instead of the plan.
How to analyse iRacing telemetry with Garage61
The workflow, in the order we used it in the workshop:
- Install the Garage61 agent and let it record. It runs in the background while you drive iRacing and uploads every lap.
- Drive representative laps. Five clean ones at a pace you can repeat, not one hero lap.
- Open the session and pick your lap — usually your fastest repeatable lap, not your fastest.
- Find a reference. Same car and track, filtered to the current season and similar conditions; check the driver's other laps for consistency; prefer about a second faster.
- Overlay the two laps.
- Read it with the method above: the biggest drop in the delta, then the line, then speed, then brake, steering and throttle. Watch for the ABS lines on the brake trace.
- Choose one change. Write it down before you get back in the car.
Then the discipline: "Don't try to copy every input at once." Twenty to thirty minutes of laps, one comparison, one change, repeat. Two cycles of that, in the coach's own experience racing, was usually worth more than an evening of laps.
How to analyse ACC telemetry with MoTeC
Assetto Corsa Competizione records telemetry itself and saves it in MoTeC's log format, which opens in the free MoTeC i2 Pro. The workflow is the same method with a heavier tool:
- In ACC's settings, set the number of telemetry laps to save above zero, then drive your laps. The logs are written to the game's MoTeC folder in your Documents.
- Open the log in MoTeC i2 and load an ACC workspace, which arranges the standard channels.
- Choose your lap and add the reference lap as an overlay.
- Open the delta graph first (MoTeC calls it time variance or time slip, depending on the workspace), then the track map, then speed, brake, steering and throttle — the same order as above.
MoTeC will show you far more than you need: tyre temperatures across the tread, suspension travel, ride heights, slip. Ignore all of it until the driving comparison is done. A full MoTeC tutorial is its own subject; the method is not.
Telemetry vs replay analysis
Use both, for different things.
Telemetry is best for exact inputs: braking point, pressure, speed, steering angle, throttle timing, and any difference measured in metres or milliseconds. It is unarguable and it is precise.
The replay is best for context: the line as it actually looks from outside, where the car was positioned, the visual references you were using, traffic, and the obvious things — a wobble, a snap, a car that was clearly on the edge — that the traces only imply. It also answers the question telemetry cannot: whether the reference lap looked comfortable.
In a lap review we use telemetry to find and measure the difference and the replay to understand it. Doing only one is how you end up with a precise measurement of the wrong thing.
Can AI analyse your telemetry?
Increasingly, yes. Several tools now compare your lap to a reference automatically and tell you that you braked earlier here, used more steering there, and reached full throttle later somewhere else. That is genuinely useful — it is the comparison half of the method, done for you.
What it does not do, yet, is the other half: decide which of those differences caused the others, and therefore which one to practise. The chain in the example above — late downshift, more brake, ABS, lost front grip, extra steering — is exactly the kind of reasoning an automatic comparison reports as five separate findings. We wrote about that distinction in can an AI sim racing coach actually make you faster.
Can telemetry help with car setup?
Yes, and the same tools show it: tyre temperatures and pressures, suspension travel, ride height, bottoming, damper behaviour, wheel slip. If the car is repeatedly bottoming on a kerb or a tyre is running hot across the whole lap, the data will say so.
But it comes with a condition. Setup telemetry only means something if the driving is consistent. If your brake pressure varies by 30% lap to lap, the tyre temperatures are describing your inconsistency, not the setup, and changing the car to fix them will make the next lap harder to read. Establish that a problem is repeatable in the driving traces first; then the setup troubleshooter is where to take a balance problem that survives that test.
A 20-minute telemetry practice routine
- 5 minutes — drive. Five clean, representative laps. Not your fastest; your most repeatable.
- 3 minutes — choose the comparison. A realistic reference in similar conditions, or your own fastest lap against your own average one.
- 3 minutes — delta. Find the biggest single loss. Ignore everything else.
- 4 minutes — diagnose. Line, then speed, then brake, then steering, then throttle. Stop at the first meaningful difference.
- 5 minutes — back in the car. Practise the one change, on that corner, with resets. Nothing else. Then compare again: that is the test.
Then repeat. This slots directly into the session structure in how to practise sim racing effectively, and it is what turns telemetry from something you look at into something that changes your driving. If you are not sure telemetry is the right tool for where you are yet, how to get better at sim racing puts it in its place in the wider process: it is a tool for people who already know what a good lap should feel like.
Questions drivers asked in the workshop
The screenshots above come from a live session with Academy members, and the questions they asked are the ones you will have too.
"Which graph tells you if you are understeering or oversteering?" The steering trace, at the bottom. More angle than the faster lap, everywhere, is understeer. Angle that goes up, comes down and goes up again is an oversteer correction. Neither of the two graphs on the left will tell you.
"Should he just brake softer?" Yes — but not by deciding to. In that corner the softer braking would have come naturally from downshifting earlier: with the engine helping, the driver feels the car slow and releases. Fix the cause and the softer brake trace appears on its own.
"What would your correction have been, rather than more steering?" The pedals. Be more patient with the throttle; if the understeer is severe and the corner is slow, a touch of brake to put weight back on the front. Never more angle. And the earlier you detect it — from the horizon, from the wheel going light — the smaller the correction needs to be.
"I only compare my own laps, not other people's. Is that wrong?" No, it is the other half. Comparing your fastest three laps against each other shows you your inconsistency — second gear here, third gear the next lap, 60% brake then 45% — which a reference driver cannot. Do both.
"Can you look at less than a full sector?" Yes. Set a custom section from the start of one braking zone to the start of the next — a corner and a half — and you see the whole story of that corner including its exit.
"How do I learn to feel understeer and oversteer earlier?" Two things from the session. First, use telemetry to check yourself: after a corner, say out loud whether the car was understeering or oversteering and where — entry, middle, or exit — then look at the steering trace to see if you were right. Second, a member's suggestion the coach fully endorsed: induce it on purpose. Turn in too early with too much throttle and feel what the car does when you know it is coming. If you can produce it, you can prevent it.
The full 71-minute walkthrough these examples come from is available to members as the Telemetry Patterns with Garage61 workshop inside the Academy, alongside the per-car telemetry comparison lessons in each masterclass.
Sim racing telemetry FAQ
What is telemetry in sim racing?
The recorded data from a lap: speed, throttle, brake pressure, gear, engine speed, steering angle and the car's position on track, sampled many times a second. A comparison tool lines two laps up by distance so you can see exactly where one driver did something different.
How do I read sim racing telemetry?
In a fixed order. Start with the lap delta to find where the time was lost, compare the racing line to check both cars drove the same corner, read the speed trace to see what happened, then use brake, steering and throttle to find why. Stop at the first meaningful difference, then test one change on track. The full method.
What telemetry should I look at first?
The lap delta, always. It tells you which corner to work on before you have looked at a single input. Opening the brake trace first is how most drivers end up fixing a consequence instead of a cause.
How do I compare two racing laps?
Pick a reference in the same car, on the same track, in similar track temperature and fuel, ideally the same setup, and realistically faster — about a second is often the most useful gap. Overlay the laps, find the biggest drop in the delta, and analyse that corner first. Choosing the reference lap.
What does a good brake trace look like?
There is no universal shape; it depends on the car, the corner, ABS and aero. The patterns that hold are getting to peak pressure quickly, coming off it progressively, and keeping the trail phase below the point where the ABS intervenes while the wheel is turned. A faster lap that goes to 100% pressure in a GT3 is fast despite its braking, not because of it.
How can telemetry show where I am losing time?
The time delta graph shows the gap between two laps at every metre. Wherever it slopes downward you are losing time; the size of the drop tells you which corners matter most. Then the line, speed and input traces tell you what was different in that corner. Worked examples.
What is the best telemetry tool for iRacing?
For most drivers, Garage61: it is free to start, records automatically and has a very large pool of comparable community laps, which is the thing that actually decides how useful an analysis is. MoTeC i2 goes deeper but needs export and a much steeper learning curve.
How do I use Garage61 telemetry?
Install the agent, drive five representative laps, open the session, choose your most repeatable lap, filter references to the current season and similar conditions, overlay, and start with the delta. Then line, speed, brake, steering, throttle — and one change per session. The step-by-step workflow.
Does ACC support MoTeC telemetry?
Yes. Assetto Corsa Competizione records telemetry natively and exports MoTeC log files, which open in the free MoTeC i2 with an ACC workspace. The analysis order is the same as for any other tool.
Can telemetry help me improve my racing line?
Yes, and it should be the second thing you check. The line-distance graph shows how far your line deviated from the reference's at every point, and the map zoom shows the two lines. If the lines differ, compare the delta to see which line is actually faster before you compare any pedal inputs.
Can AI analyse sim racing telemetry?
Increasingly, yes: tools now compare two laps automatically and report where you braked earlier or used more steering. What they do not yet do is decide which difference caused the others and therefore which one to practise, which is the part that changes your driving.
Why is my minimum corner speed lower than the faster driver's?
Usually because you braked earlier, or harder for longer, not because you need to carry more speed. Check the brake trace for the crossover point where your deceleration exceeded theirs. Carrying more speed into a corner you are over-slowing will not fix an over-braking habit.
This guide is part of the free library at GitGud Racing Academy — an online sim racing academy built around weekly lap reviews, structured courses, drills and training tools.
Train this the right way
Reading is step one. Build it into muscle memory with structured, car-specific courses and personal lap reviews from a coach — inside the Academy.
Join the Academy · $35.99/mo incl. VAT